Hello Subscribers,
I hope you’re doing well.
Here is another blog post featuring one of the trade setups we identified and shared with members. We closed numerous trades for substantial profits throughout June and July, and in the coming blog posts, I’ll be sharing some of those setups with you.
And yes, these were big profits.
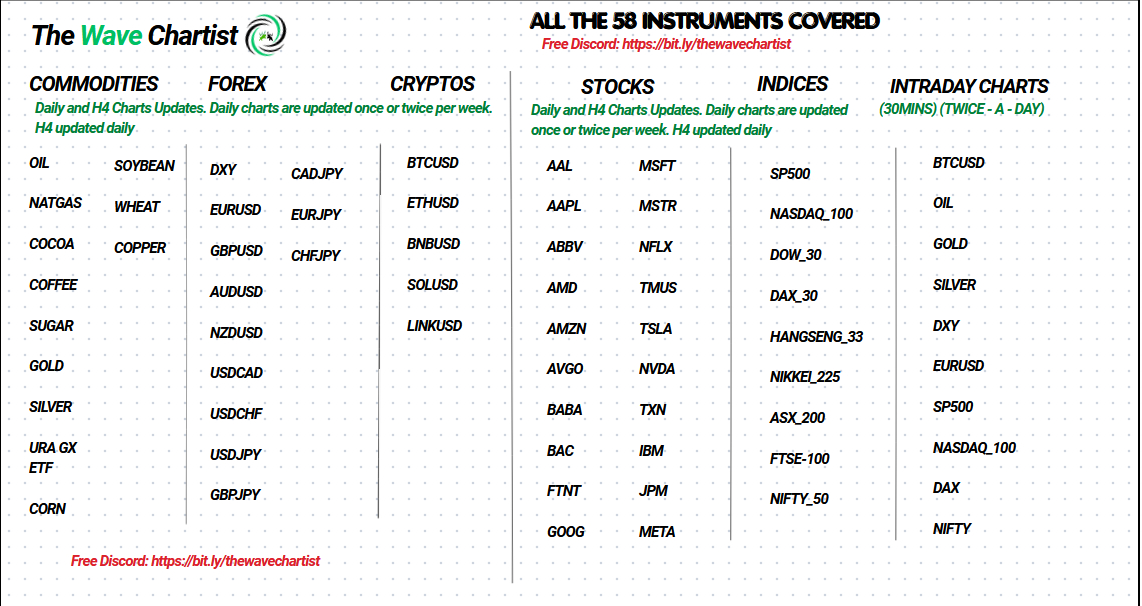
As you know, subscribers to The Wave Chartist receive daily Elliott Wave forecasts covering 66 instruments across multiple asset classes:
5 Cryptocurrencies
12 Forex pairs
12 Commodities
9 Indices
20 Stocks
8 ETFs
In addition, we maintain a pool of up to 30 stock requests from members, which we analyze every week. The list changes as members submit new requests.
How We Approach the Markets
We like to start every week with a market guidance video, helping members understand the broader sentiment and our directional bias across each major instrument class.
We don’t analyze markets in isolation. We look at the financial markets as one interconnected system and examine how different asset classes correlate with one another. This helps us identify where the strongest opportunities may be developing.
Around the middle of the week, we update the guidance video as market conditions evolve.
On top of that, almost every day, we share trade ideas through a monitored spreadsheet, including entry, stop-loss, and target levels. These ideas are continuously monitored and updated as price develops.
At the moment, we are over 30R in profit for the year, with as many as 10 open trades currently in profit but yet to reach their targets.
If all of those trades eventually hit their targets, our performance could potentially move toward 50R.
For example, if you risked 2% per trade, 30R would represent a 60% gain before considering the additional open positions. We boast of a 65% winning rate on 1:2 RR, with the rest of 35% either full stop, half stop or breakeven.
Of course, past performance is not a guarantee of future results, and position sizing and risk management remain critical.
Apologies for the little bit of “showing off.” 😄
Now, let’s look at one of the short-term trade setups we identified in Oil during the second week of July.
Silver Trade Setup - 01 July 2026 / 30mins Charts
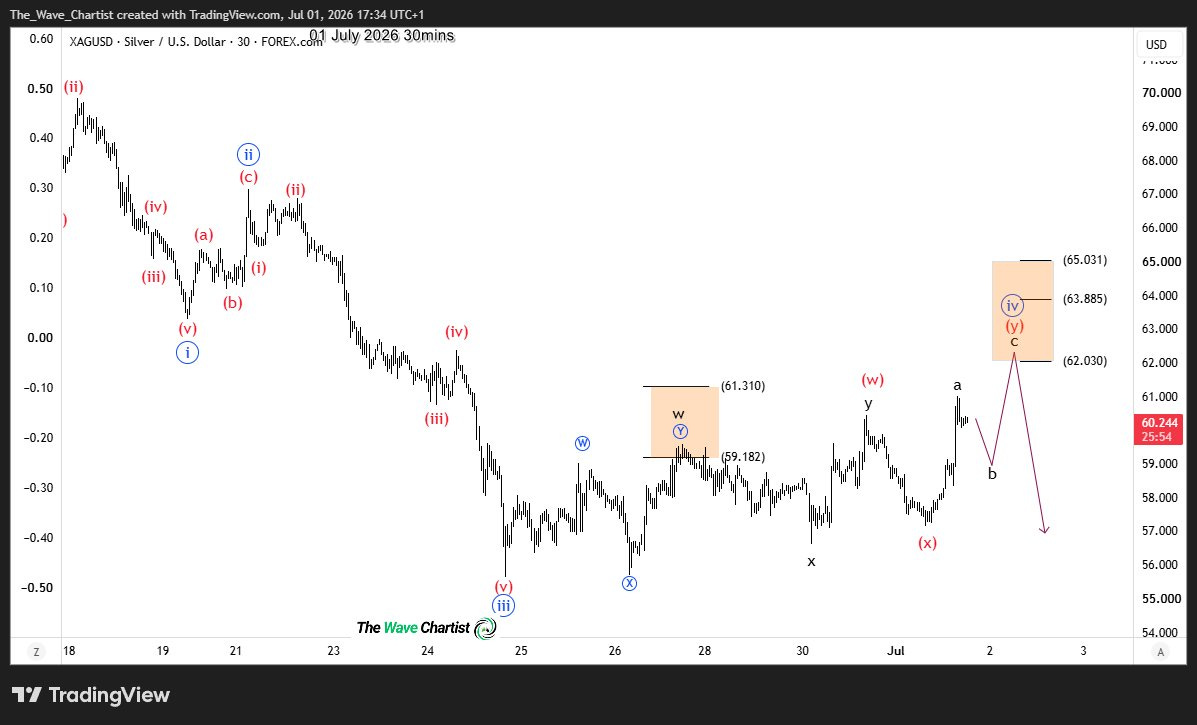
Silver is in a bearish cycle from late January 2026. However, this bearish run appears incomplete. We shared the chart below on 1st July 2026 to The Wave Chartist private Discord server.
We identified a double zigzag structure close to completing wave ((iv)) of the bearish leg from 13th May. We provided subscribers with the orange zone - 62.03-65.03 where they can put in a short position. In addition, we provided the entry, exit and target prices. We set our target at $56 with the stop loss a bit above $65 and entry at nearly $62.
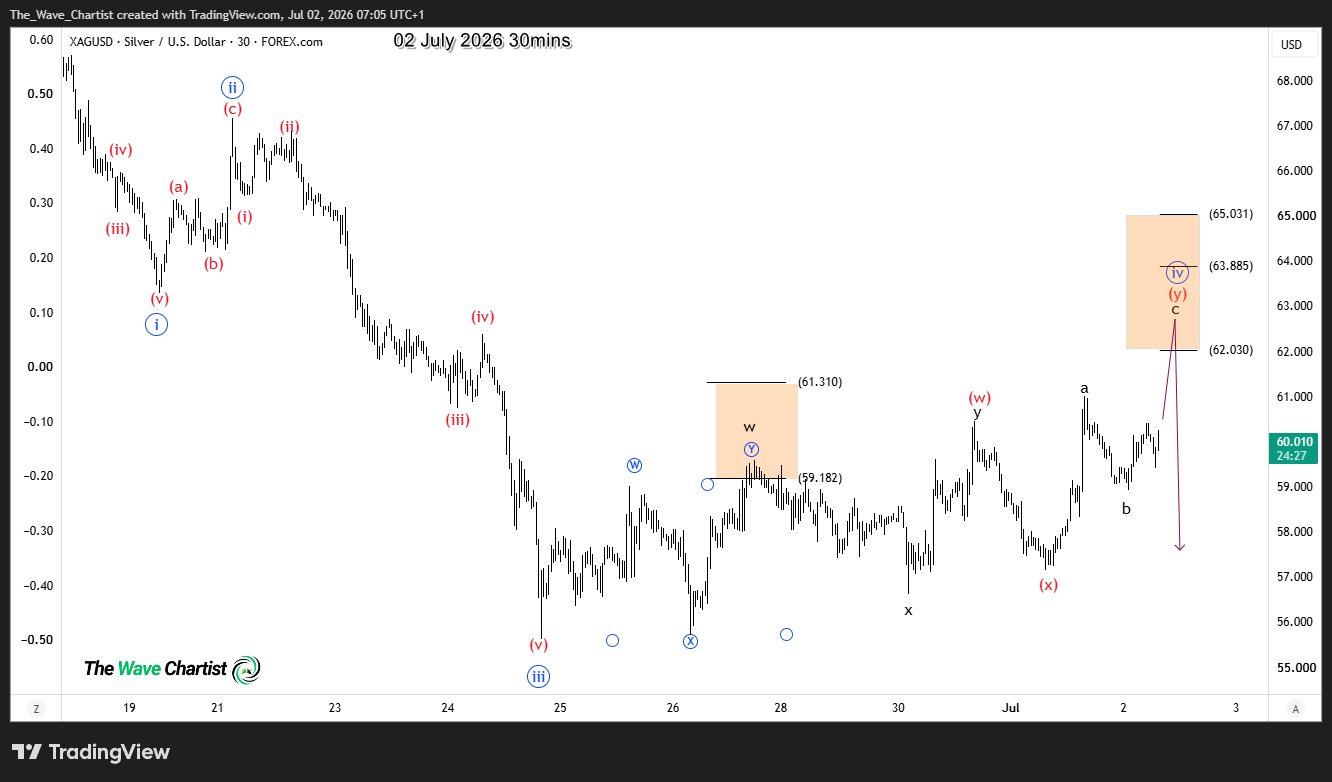
We followed up with the chart below on 2nd July 2026
TRIGGER & PROFIT - 03 July, 2026 / 30mins
On 3rd July, we shared the chart below to show shorts triggered in the orange zone. Thus, we identified the price falling at least to $56, where we intent taking profit.
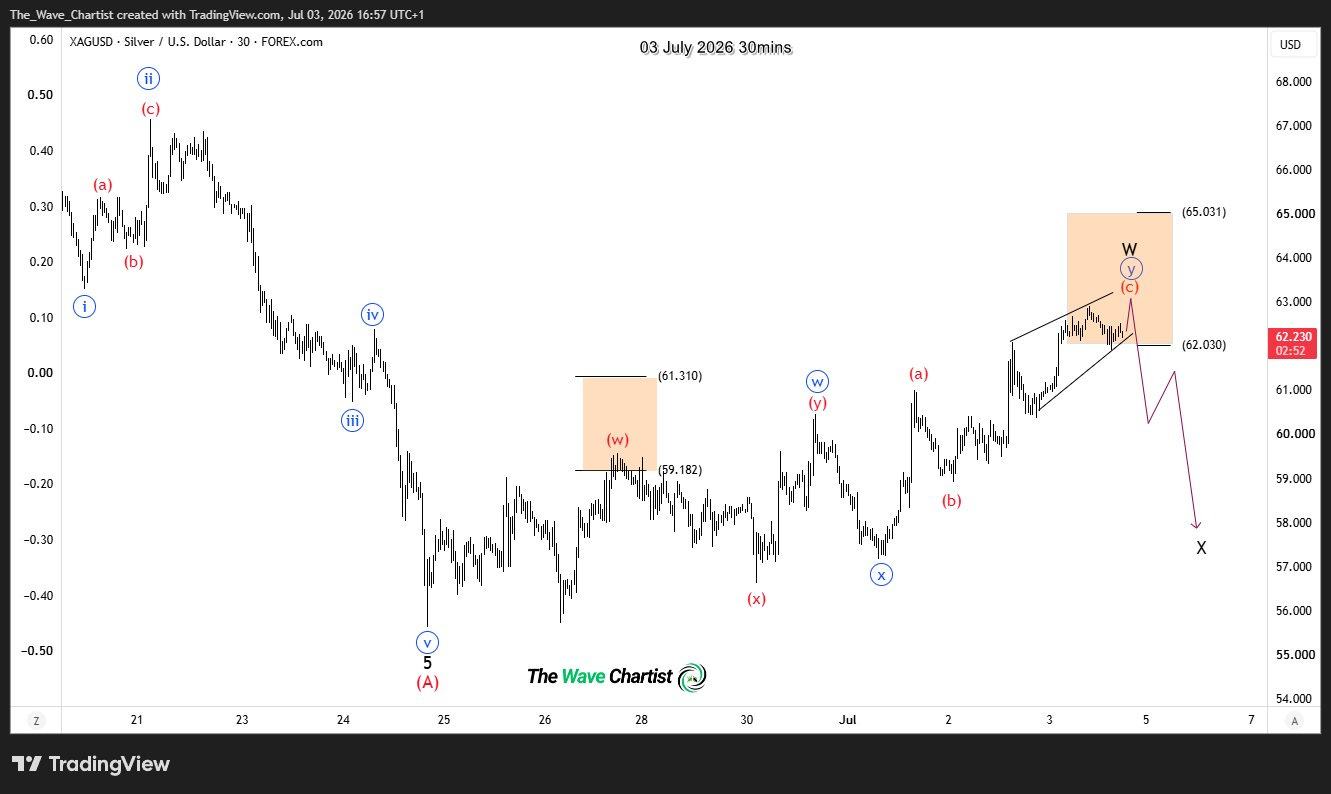
Silver plummeted as expected and hit the $56 target.
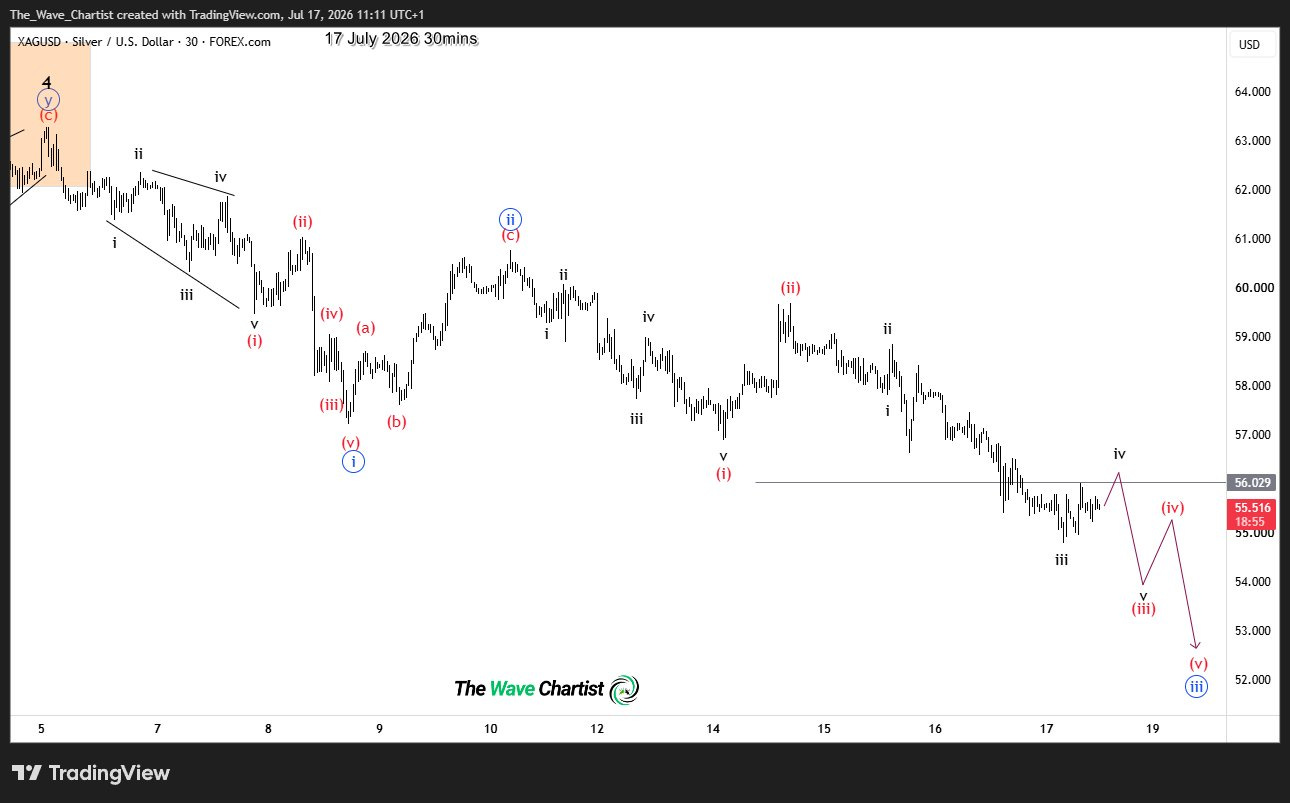
This is another short-term trade on the 30-minute charts shared in our intraday updates. We share the 30-minute chart updates twice a day for Silver, Gold, Oil, BTC, Nasdaq, SPX, DAX, Nifty, DXY and EURUSD.
The Wave Chartist Discord Server
Get multi-timeframe coverage on 65 instruments across Forex, crypto, commodities, and indices.
Receive Daily and H4 updates for broader trend context, plus twice-daily intraday analysis with 30-minute charts on 10 major instruments. The service also includes bi-weekly video breakdowns, clearly defined trade zones on every chart, and a transparent trade journal for performance tracking.