Hello subscribers
Here is a bearish setup we spotted on Gold in late June
When XAUUSD broke below the 23 March low, it confirmed that the bearish cycle from the late January 2026 high was extending, signaling further downside. Following the breakdown, we consistently advised members to sell rallies rather than attempt to pick a bottom.
Interestingly, Gold has now completed a 5-swing decline from the 17 April 2026 high. Since our preferred Elliott Wave structure calls for at least a 7-swing sequence, the short-term outlook remains bearish. In line with this view, we identified a high-probability selling zone on the 30-minute chart and shared the setup with members in our intraday updates.
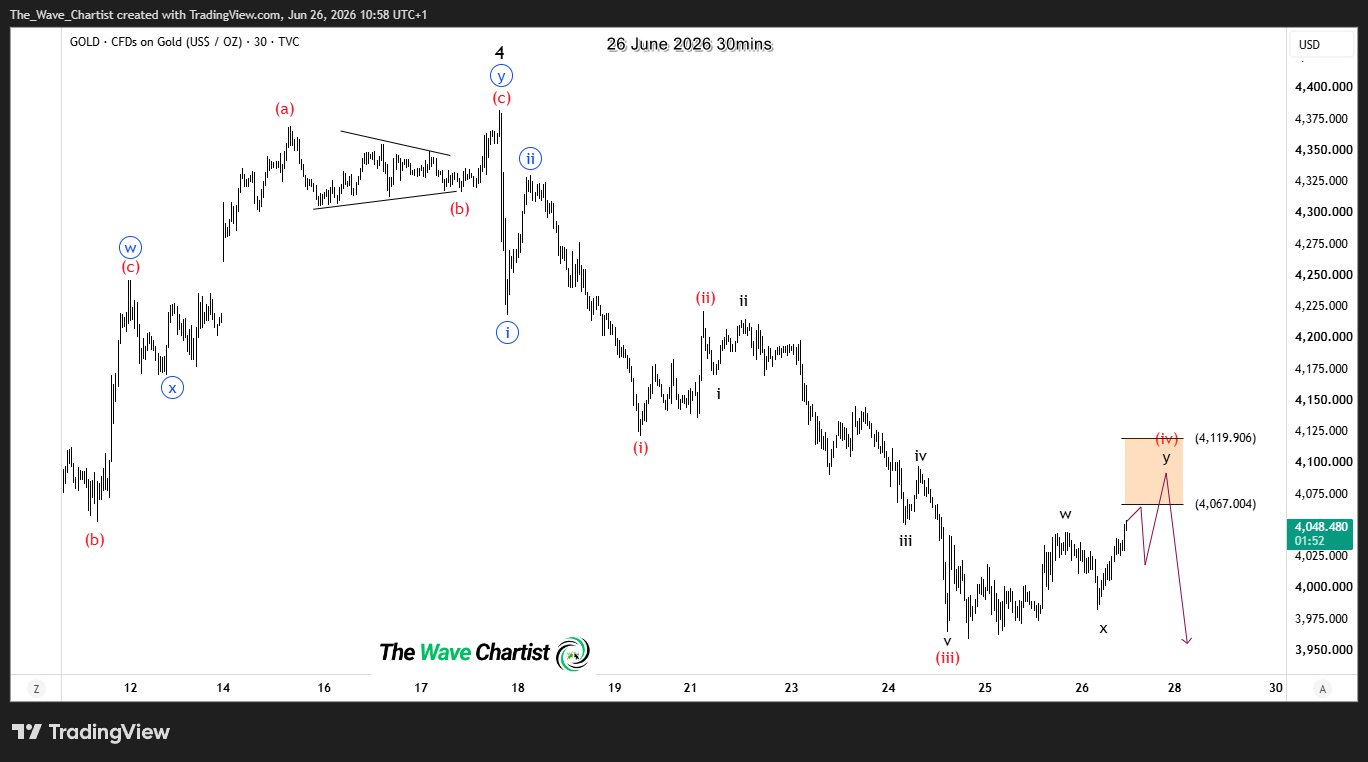
Trade Setup - 26th June 2026 / 30mins Charts
After wave 4 of (A) completed on 17 June, Gold resumed its decline, breaking to a fresh low within the bearish cycle that began in January 2026. The subsequent recovery unfolded as wave (iv), presenting another opportunity to align with the prevailing downtrend.
Based on this outlook, we advised members to sell the bounce from the orange resistance zone between 4067 and 4119, as highlighted on the 30-minute chart published on 26 June 2026.
TRIGGER & PROFIT - 29th June, 2026 / 30mins
Before the end of that week, the price triggered the sell zone and members went short in a pending order. The second chart shows the metal fell sharply to complete the 3rd minute wave of 5 of (A) after shedding 155 points from the zone to reach over 1:2 RRR for premium Discord subscribers.
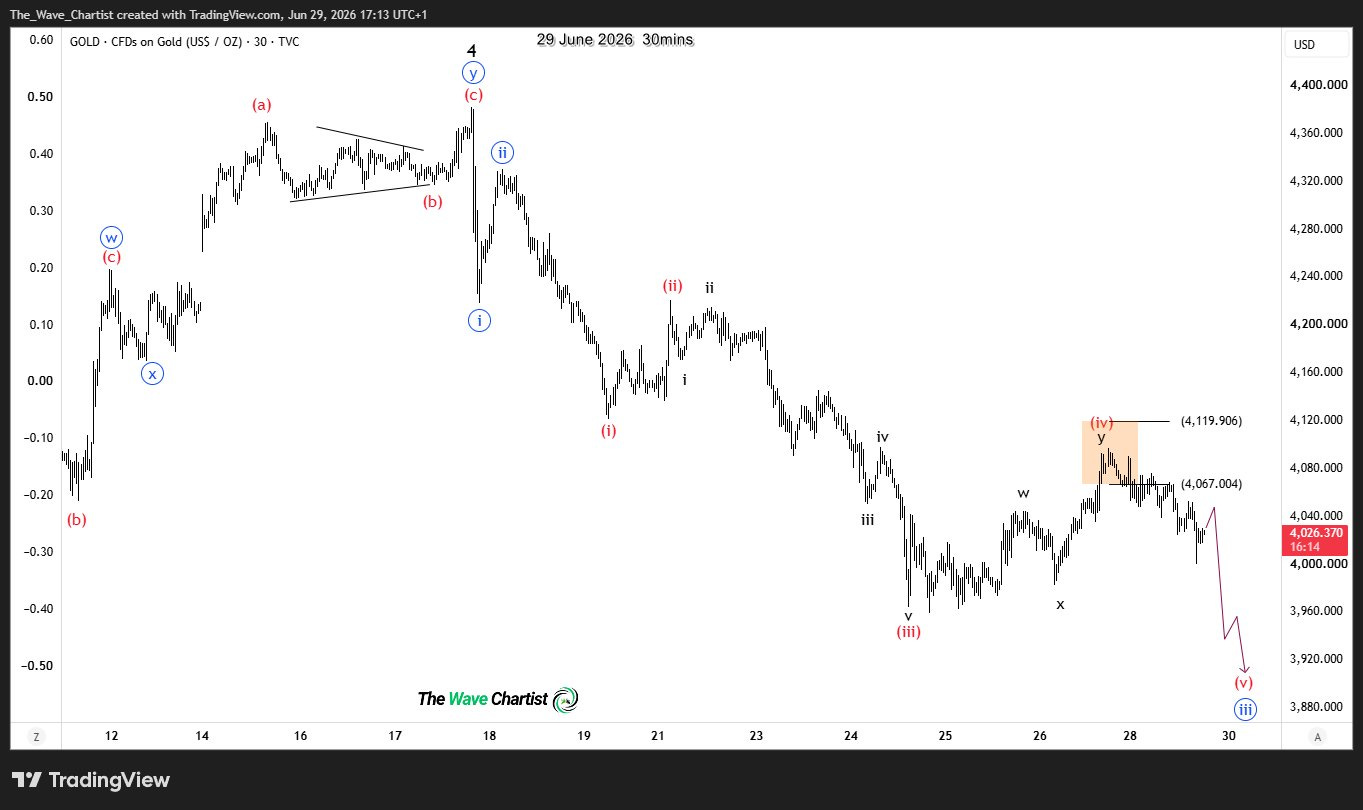
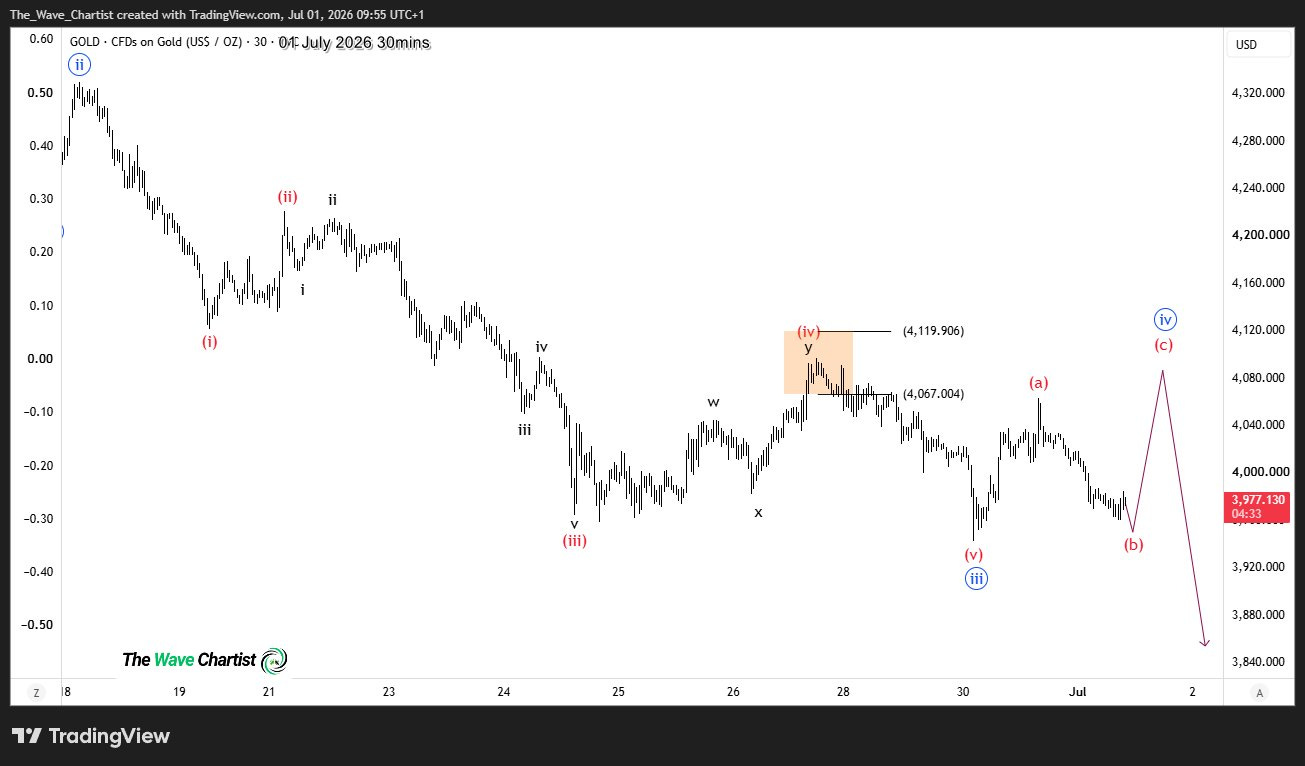
A very smooth and fast short-term trade. Join our Discord Server for more analysis, forecasts, trade signals and intermarket technical guidance on major asset classes and over 65 instruments. Read more below.
The Wave Chartist Discord Server
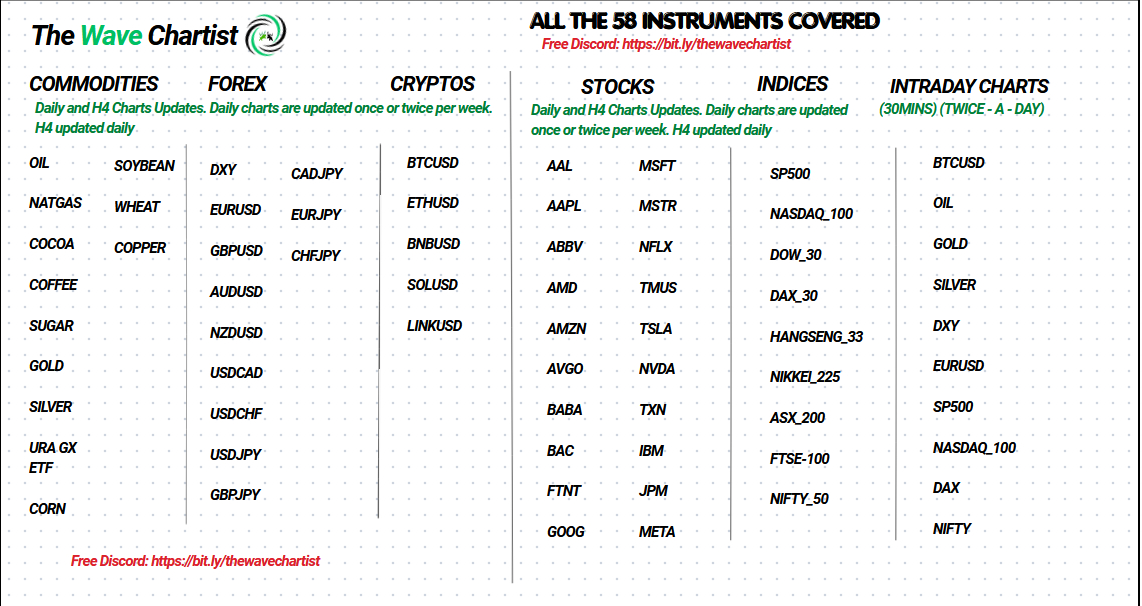
Get multi-timeframe coverage on 65 instruments across Forex, crypto, commodities, and indices.
Receive Daily and H4 updates for broader trend context, plus twice-daily intraday analysis with 30-minute charts on 10 major instruments. The service also includes bi-weekly video breakdowns, clearly defined trade zones on every chart, and a transparent trade journal for performance tracking.